
 Translate
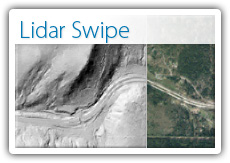
King County Lidar Swipe
Interactive map viewer
 LAUNCH
|
Lidar is an aerial scanning method that can produce detailed representations of the earth's surface. The Lidar Swipe map viewer is designed to provide users a simple means for viewing a shaded-relief image that was made from lidar data. The viewer shows a King County-maintained mosaic of lidar data that has been collected in various scans over King County and southwest Snohomish County, along with an aerial-photo map for orientation and comparison. |
What’s on view?
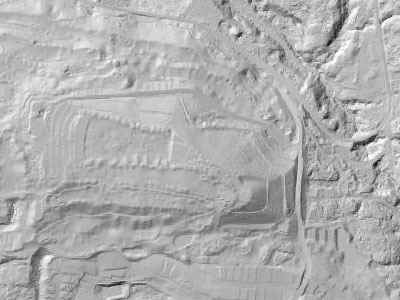
Lidar shaded relief
The grayscale, shaded-relief depiction of the earth's surface in this map viewer represents data that was collected by lidar—an aerial remote-sensing process in which pulses of laser light from instruments in flight are directed downward and their reflections are recorded and analyzed. Like radar, which uses radio signals rather than laser light, lidar measures distance by detecting the amount of time it takes for each reflected pulse to return to its source.
By combining the distance that each pulse has traveled with GPS and other flight data that precisely fixes the aircraft's position at any moment during its flight, the horizontal and vertical position of every point on the ground that reflects a laser pulse can be calculated. The high frequency of light pulses inherent in the technology (many thousands of pulses per second) enables a high-density, three-dimensional network of points―a "point cloud"―to be created for a lidar-scanned area. The point-cloud data can then be used to create a digital ground elevation model (DGM) that has more detail than can be produced by other remote-sensing methods, such as stereo photogrammetry.
The shaded-relief image in the King County Lidar Swipe map viewer was derived mathematically from a DGM by calculating the intensity of simulated sunlight reflected from calculated ground-slope angles. This particular DGM, which has a resolution of approximately 6 feet per pixel, was made primarily from a mosaic of lidar data that was collected over King County and southwest Snohomish County from 2001 through 2004 by various agencies, including the Puget Sound Lidar Consortium and King County. The DGM includes supplements and revisions made from lidar data collected for specific study areas in 2007 and 2009–2012. Even newer data is being added in an ongoing effort to ensure that every part of the geographic extent of the DGM is represented by the best and most current data available for that location.
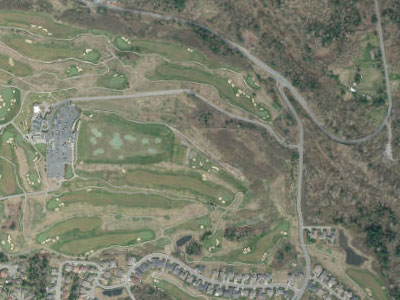
2012 aerial photography
The map viewer is displaying a natural-color mosaic of digital aerial photographs that were taken from March through May of 2012 with the intent of representing leaf-off conditions. The urbanized portions of western King County were photographed at a resolution of 3 inches per pixel. Central King County and southwest Snohomish County were photographed at a resolution of 6 inches per pixel. The remainder of the imagery is at a resolution of 12 inches per pixel. All of these resolutions are considerably higher than that of the shaded-relief lidar image, so map-viewer users can expect to see the aerial photo image maintain greater sharpness than the lidar image when zooming in to very high magnifications.
More information
King County GIS Metadata: digital elevation data (lidar)
King County GIS Metadata: 2012 natural-color aerial imagery