 Translate
Climate change impacts in King County
King County is already experiencing the impacts of climate change
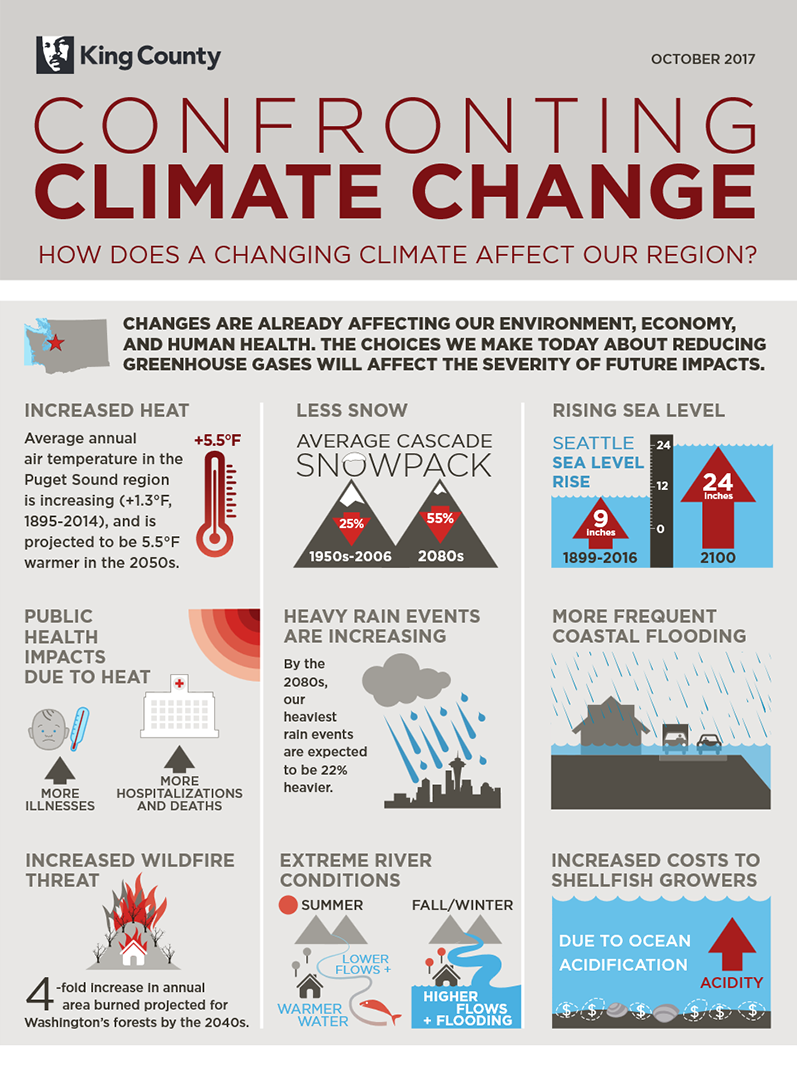
Confronting climate change: how does a changing climate affect our region?
October 2017
Changes are already affecting our environment, economy and human health. The choices we make today about reducing greenhouse gases will affect the severity of future impacts.
Increased heat
Average annual air temperature in the Puget Sound region is increasing (+1.3F, 1895-2014), and is projected to be 5.5F warmer in the 2050s.
Public health impacts due to heat
- More illnesses
- Mor hospitalizations and deaths
Increased wildfire threat
Four-fold increase in annual area burned projected for Washington's forests by the 2040's.
Less snow
Average Cascade snowpack down 25% from 1950s to 2006, projected decrease of 55% in the 2080s.
Heavy rain events are increasing
By the 2080s, our heaviest rain events are expected to be 22% heavier.
Extreme river conditions
- Summer - lower flows, warmer water
- Winter - higher flows, flooding
Rising sea level - Seattle sea level rise
- 1899-2016 - 9 inches increase
- by 2100 - 24 inches increase
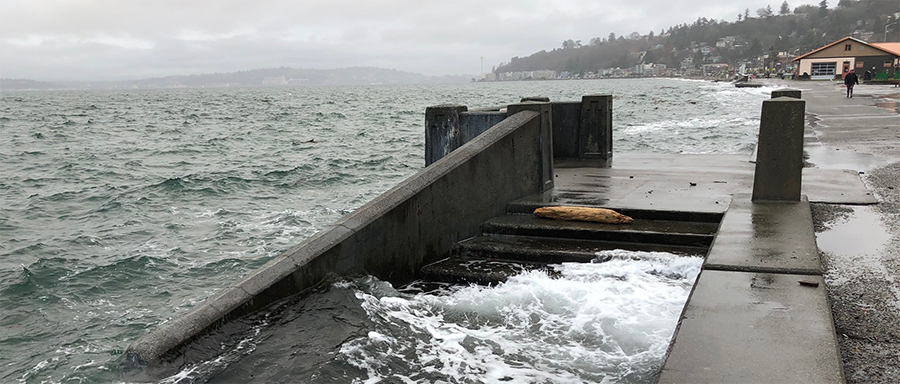
More coastal flooding
Increased costs to shellfish growers due to ocean acidification.
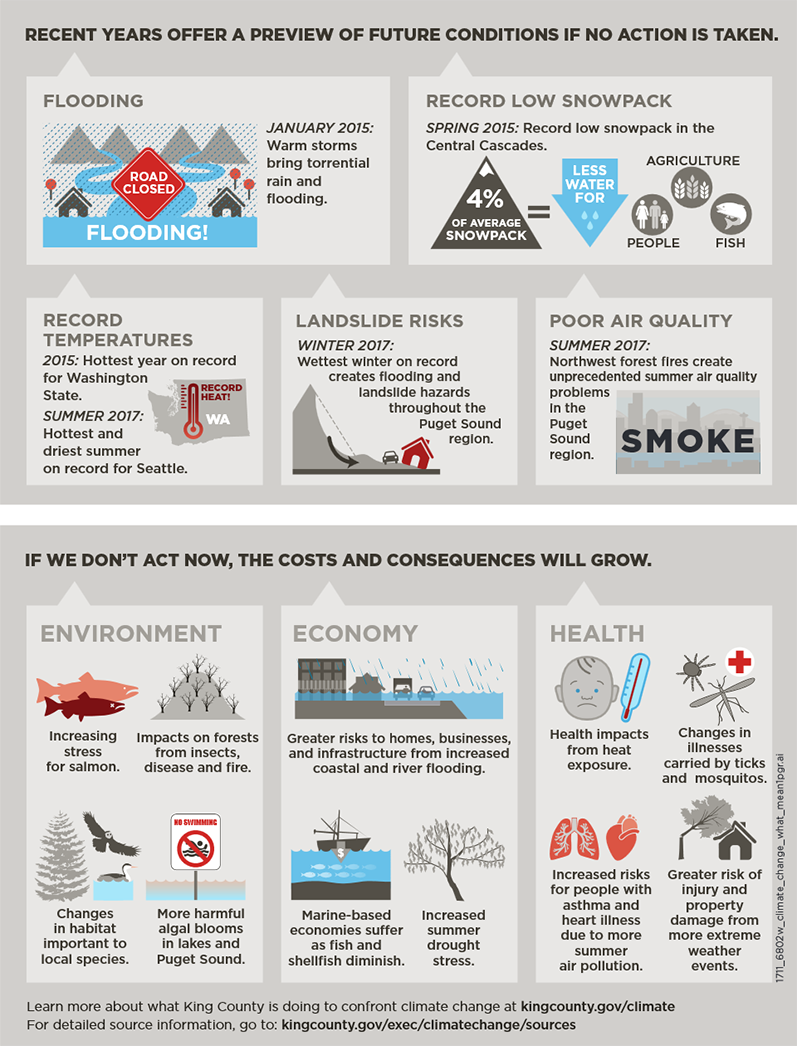
Recent years offer a preview of future conditions if no action is taken.
Flooding
January 2015: Warm storms bring torrential rain and flooding
Record low snowpack
Spring 2015: Record low snowpack in the Central Cascades. Four percent of average snowpack meant less water for people, agriculture and fish.
Record temperatures
2015: Hottest year on record for Washington State.
Summer 2017: Hottest and driest summer on record for Seattle.
Landslide risks
Winter 2017: Wettest winter on record creates flooding and landslide hazards throughout the Puget Sound region.
Poor air quality
Summer 2017: Smoke from northwest forest fires create unprecedented summer air quality problems in the Puget Sound Region.
If we don't act now, the costs and consequences will grow
Environment
- Increasing stress for salmon
- Impacts on forests from insects, disease and fire
- Changes in habitat important to local species
- More harmful algal blooms in lakes and Puget Sound
Economy
- Greater risks to homes, businesses, and infrastructure from increased coastal and river flooding.
- Marine-based economies suffer as fish and shellfish diminish.
- Increased summer drought stress.
Health
- Health impacts from heat exposure
- Changes in illnesses carried by ticks and mosquitoes
- Increased risks for people with asthma and heart illness due to more summer air pollution.
- Greater risk of injury and property damage from more extreme weather.
Learn more about what King County is doing to confront climate change at kingcounty.gov/climate. For detailed source information, visit the sources page.