|
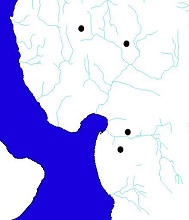 Vector – The ‘core’ of an enterprise GIS Warehouse, vector data includes GIS data with which users are most generally familiar. Roadways depicted as lines, firestations as points and lakes and ponds shown as polygons (areas) are just some examples of vector data representing real-life features. In some software packages, vector data can have more complex structure, such as measures along lines (i.e., roads), or areas of polygon overlap such as animal habitat zones. But generally vector data is a straight forward digital version of the lines that define the shape or boundary of a map feature. Within the SDW, vector data is stored as Geodatabase (GDB) feature classes and as shapefiles. ArcInfo coverages are no longer maintained by KCGIS. Users are guided by their GIS needs and GIS software as to which version to choose. Most GIS data obtained from non-KCGIS data sources (i.e., external data) is stored only as shapefiles, while KC-maintained data is stored in the GDB and as shapefiles. ArcView 3.x users can access only shapefiles, while ArcGIS software can use GDB featureclasses and shapefiles.Vector data often store significant amounts of attribute data or details about features in the data set, providing the real power in using GIS for queries and analyses. What vector data generally does not provide is any 3-D representation, as this format of data usually describes only the map or 2-D view of the world. Vector – The ‘core’ of an enterprise GIS Warehouse, vector data includes GIS data with which users are most generally familiar. Roadways depicted as lines, firestations as points and lakes and ponds shown as polygons (areas) are just some examples of vector data representing real-life features. In some software packages, vector data can have more complex structure, such as measures along lines (i.e., roads), or areas of polygon overlap such as animal habitat zones. But generally vector data is a straight forward digital version of the lines that define the shape or boundary of a map feature. Within the SDW, vector data is stored as Geodatabase (GDB) feature classes and as shapefiles. ArcInfo coverages are no longer maintained by KCGIS. Users are guided by their GIS needs and GIS software as to which version to choose. Most GIS data obtained from non-KCGIS data sources (i.e., external data) is stored only as shapefiles, while KC-maintained data is stored in the GDB and as shapefiles. ArcView 3.x users can access only shapefiles, while ArcGIS software can use GDB featureclasses and shapefiles.Vector data often store significant amounts of attribute data or details about features in the data set, providing the real power in using GIS for queries and analyses. What vector data generally does not provide is any 3-D representation, as this format of data usually describes only the map or 2-D view of the world.
|
|
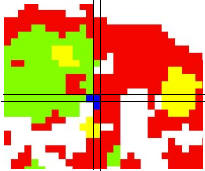 Lattice/Grid – Though there are some technical differences in these types, Lattice and Grid, as well as the term Raster, can be used synonymously to describe a data format that stores positional (horizontal) location information in a row-column (Cartesian) structure, a highly efficient data storage, access, and manipulation format. The individual row-column intersects are called cells, grid cells, or in the case of imagery, pixels (see below). Besides these functional advantages, grids or rasters are designed to store attributes. Though some grids may store multiple attributes just like vector data, grids usually store only a single numerical value which can represent a range of real life values such as biological sample data, rainfall amounts, or a gray or color-scale value representing a picture element (i.e., pixel). One of the most common applications of grids is where this numerical value, called the ‘Z’ value, stores a number representing elevation. This makes grid data very useful for 3-D analysis and display when you have the appropriate software. Grids and images share a common data model so some grids, such as hillshades, can be displayed intelligently as images in ArcView 3.x and other software. Others, like an elevation grid, display as an image but do not provide much functionality. Users with a strong demand for analyzing and manipulating grid data, such as creating a shaded relief display, will require Spatial Analyst or similar extensions to their GIS software. Lattice/Grid – Though there are some technical differences in these types, Lattice and Grid, as well as the term Raster, can be used synonymously to describe a data format that stores positional (horizontal) location information in a row-column (Cartesian) structure, a highly efficient data storage, access, and manipulation format. The individual row-column intersects are called cells, grid cells, or in the case of imagery, pixels (see below). Besides these functional advantages, grids or rasters are designed to store attributes. Though some grids may store multiple attributes just like vector data, grids usually store only a single numerical value which can represent a range of real life values such as biological sample data, rainfall amounts, or a gray or color-scale value representing a picture element (i.e., pixel). One of the most common applications of grids is where this numerical value, called the ‘Z’ value, stores a number representing elevation. This makes grid data very useful for 3-D analysis and display when you have the appropriate software. Grids and images share a common data model so some grids, such as hillshades, can be displayed intelligently as images in ArcView 3.x and other software. Others, like an elevation grid, display as an image but do not provide much functionality. Users with a strong demand for analyzing and manipulating grid data, such as creating a shaded relief display, will require Spatial Analyst or similar extensions to their GIS software.
|
|
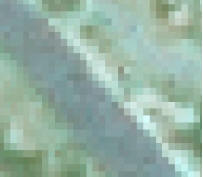 Image - Images are really just a flavor of a grid or raster. Even though there are multiple image types, when the term image is used in KCGIS context, it usually means orthophotography (i.e., aerial or high-resolution satellite imagery). Images store their positional, that is x, y, location information in a pixel by pixel pattern just like grids, but in this case the ‘Z’ value is a number which is interpreted by software as a shade of gray, as in a panchromatic image, or a Red-Blue-Green color pattern as in color photography. The ‘Z’ value is just a number so it can be manipulated as in a grid, allowing image analysis to be performed or imagery color or display characteristics to be modified. Imagery provides a key cartographic role such as orthoimagery serving as an up-to-date background to other vector datasets. As King County builds a more complete image data library, legacy imagery will become increasingly important in evaluating change conditions. Because of the common usage of imagery in GIS, most software supports a range of image file types such as TIF, IMG, etc., with installed or no-cost extensions. Image - Images are really just a flavor of a grid or raster. Even though there are multiple image types, when the term image is used in KCGIS context, it usually means orthophotography (i.e., aerial or high-resolution satellite imagery). Images store their positional, that is x, y, location information in a pixel by pixel pattern just like grids, but in this case the ‘Z’ value is a number which is interpreted by software as a shade of gray, as in a panchromatic image, or a Red-Blue-Green color pattern as in color photography. The ‘Z’ value is just a number so it can be manipulated as in a grid, allowing image analysis to be performed or imagery color or display characteristics to be modified. Imagery provides a key cartographic role such as orthoimagery serving as an up-to-date background to other vector datasets. As King County builds a more complete image data library, legacy imagery will become increasingly important in evaluating change conditions. Because of the common usage of imagery in GIS, most software supports a range of image file types such as TIF, IMG, etc., with installed or no-cost extensions.
|
|
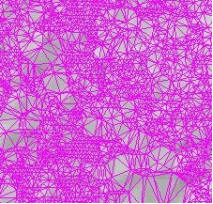 TIN – (Triangulated Irregular Network). It is another format for storing 3 dimensional data that has an x, y and z value. In the case of a TIN the Z value is stored with links to adjacent nodes so that the data more closely represents a continuous surface than a grid or lattice representation. Like in a grid or lattice, the Z value can represent any quantifiable value, but TINs are often associated with storing and displaying elevation data. They are somewhat specialized in that they require 3-D analysis and display software such as ArcView or ArcGIS 3-D analyst. Because there is a continuity relationship between all data formats, TINs can be converted into grids and also in vector equivalents. However this changes the way the data is modeled and usually involves some interpolation of the data thus reducing the functionality of the TIN format. Even though TINs generally store only a single Z value as an attribute, the TIN format creates very large files as they store the relationship between all the features within the data. TINs representing thousands or millions of points are not uncommon and their resulting file size limits TINs to a relatively small tile extent covering a limited geographic area. TIN – (Triangulated Irregular Network). It is another format for storing 3 dimensional data that has an x, y and z value. In the case of a TIN the Z value is stored with links to adjacent nodes so that the data more closely represents a continuous surface than a grid or lattice representation. Like in a grid or lattice, the Z value can represent any quantifiable value, but TINs are often associated with storing and displaying elevation data. They are somewhat specialized in that they require 3-D analysis and display software such as ArcView or ArcGIS 3-D analyst. Because there is a continuity relationship between all data formats, TINs can be converted into grids and also in vector equivalents. However this changes the way the data is modeled and usually involves some interpolation of the data thus reducing the functionality of the TIN format. Even though TINs generally store only a single Z value as an attribute, the TIN format creates very large files as they store the relationship between all the features within the data. TINs representing thousands or millions of points are not uncommon and their resulting file size limits TINs to a relatively small tile extent covering a limited geographic area.
|
|
 ASCII – (American Standard Code for Information Interchange). Data in this format is simply a line-by-line listing of information in text format that takes on a geographical meaning when the listing contains positional coordinate information. Text information can be easily imported into most GIS and CAD-based software programs and it is this flexibility that drives storing some point data sets in this format. When possible most point data sets are stored as vector datasets to make them more consumable to ArcView and ArcGIS software packages. However, in the case of the elevation data that originate as very large ASCII files, storage as vector point files is not efficient for display and analysis, but the point data can be accessed when necessary. ASCII – (American Standard Code for Information Interchange). Data in this format is simply a line-by-line listing of information in text format that takes on a geographical meaning when the listing contains positional coordinate information. Text information can be easily imported into most GIS and CAD-based software programs and it is this flexibility that drives storing some point data sets in this format. When possible most point data sets are stored as vector datasets to make them more consumable to ArcView and ArcGIS software packages. However, in the case of the elevation data that originate as very large ASCII files, storage as vector point files is not efficient for display and analysis, but the point data can be accessed when necessary.
|
|
 DWG/DXF – Another flavor of vector data developed for and used extensively in engineering CAD (Computer Aided Drawing) software. As the line between GIS and traditional CAD software and data types continues to blur, the industry has improved the compatibility, and thus sharing of these data types. Drawing files (DWG) and the ASCII export version (DXF) are broadly used to store planimetric linework such as roads, water/sewer infrastructure, and legal description information by public work agencies, survey departments and utility companies. For GIS users this data is often converted to GIS-type formats such as vector shapefiles, but DXF and DWG can also be read directly by most GIS software. These CAD data types provide a key bridge between GIS and engineering applications. For example the LiDAR-derived elevation contours in the SDW are provided in both vector shapefile and vector DWG format. Though CAD formats provide accurate and detailed location information they do not store attribute information in the same way as GIS vector data does but rather provide more limited descriptive information in the LAYER and other DWG entity values. DWG/DXF – Another flavor of vector data developed for and used extensively in engineering CAD (Computer Aided Drawing) software. As the line between GIS and traditional CAD software and data types continues to blur, the industry has improved the compatibility, and thus sharing of these data types. Drawing files (DWG) and the ASCII export version (DXF) are broadly used to store planimetric linework such as roads, water/sewer infrastructure, and legal description information by public work agencies, survey departments and utility companies. For GIS users this data is often converted to GIS-type formats such as vector shapefiles, but DXF and DWG can also be read directly by most GIS software. These CAD data types provide a key bridge between GIS and engineering applications. For example the LiDAR-derived elevation contours in the SDW are provided in both vector shapefile and vector DWG format. Though CAD formats provide accurate and detailed location information they do not store attribute information in the same way as GIS vector data does but rather provide more limited descriptive information in the LAYER and other DWG entity values.
|
|
 Tabular databases – Microsoft Access, SQL Server, Oracle and other relational database systems serve as storage and access software for a wide range of tabular data tables. ASCII data is often moved to a tabular database arranged in a logical integrated manner that emphasizes relationships between the data sets. As mentioned above, vector data also incorporates this functionality in storing the data as attributes, but large complex business tables such as financial records, census data, etc., are stored and managed as tables in these more efficient databases. This allows the data to be served up from a central point to a variety of web-based applications and query and reporting applications. GIS data, particularly vector data, can also access these databases through connections within the GIS software establishing a relationship between the spatial location of features and the descriptive information about them. Extracts of information from these relational databases is sometimes stored in standalone dbase-format (dbf) tables that are highly compatible with shapefile format data and can be joined to the shapefile dbf attribute table. As we move to fully integrate spatial data and attribute data into seamless datasets these standalone tables will become less common. Tabular databases – Microsoft Access, SQL Server, Oracle and other relational database systems serve as storage and access software for a wide range of tabular data tables. ASCII data is often moved to a tabular database arranged in a logical integrated manner that emphasizes relationships between the data sets. As mentioned above, vector data also incorporates this functionality in storing the data as attributes, but large complex business tables such as financial records, census data, etc., are stored and managed as tables in these more efficient databases. This allows the data to be served up from a central point to a variety of web-based applications and query and reporting applications. GIS data, particularly vector data, can also access these databases through connections within the GIS software establishing a relationship between the spatial location of features and the descriptive information about them. Extracts of information from these relational databases is sometimes stored in standalone dbase-format (dbf) tables that are highly compatible with shapefile format data and can be joined to the shapefile dbf attribute table. As we move to fully integrate spatial data and attribute data into seamless datasets these standalone tables will become less common.
|
|
GeoDatabase – This close association between spatial vector data and relational database tables is taken toward a single common format in this next generation of data storage. As primarily a new data storage mechanism, not really a new data type, GIS data users will still recognize data they access through a geodatabase in the common forms discussed above. Beyond enhanced storage efficiencies and improvements in access speeds, geodatabases will help integrate the spatial data of organizations with their extensive business table data. Users will move from accessing their common data types in a file-based model as now done to a design where all GIS data – location and attribute – is accessed from a relational database.
|

 Translate