
 Translate
Public Health — Seattle & King County
Protecting and improving the health and well-being of King County
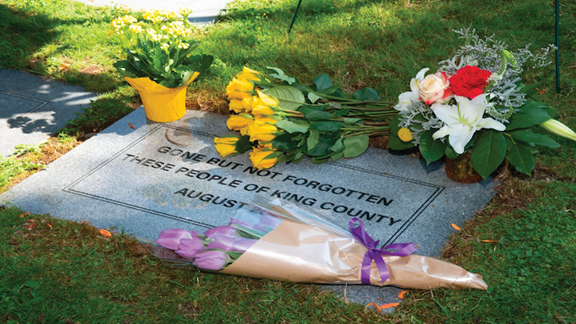
Lives lost but not forgotten – 2023 Indigent Remains ceremony
Public Health Insider blog (9/25/23)
Services and resource directory
Monkeypox resources
COVID-19 resources
Get COVID-19 vaccine
Get routine vaccines
Facebook
Twitter
Instagram
Public Health Insider blog
COVID-19 resources
Get COVID-19 vaccine
Get routine vaccines
Public Health Insider blog
Subscribe to our newsletter:
This Month in Public Health
This Month in Public Health